
MRI Fascicle Score Associated With Hypermobile Lateral Meniscus
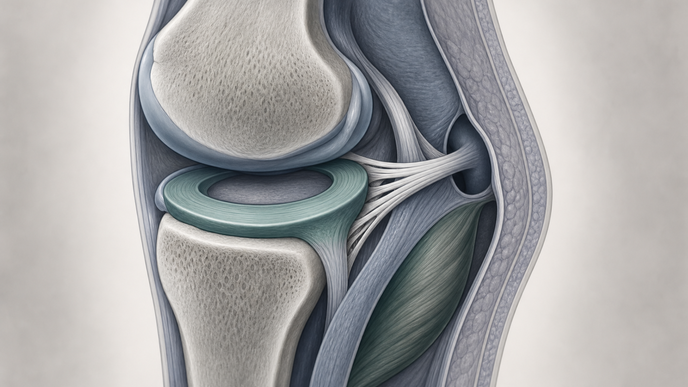
Key Takeaways
- Among arthroscopically assessed surgical knees in South Korea, lower combined PMF scores were associated with HLM for sagittal MRI SI.
- Static LM–popliteal tendon separation and ROI area did not significantly differ between groups.
- Higher sagittal SI ratio lost its independent association with HLM after accounting for the combined PMF score.
- The cohort-derived PMF threshold was more specific than sensitive for HLM.
At Korea University Ansan Hospital in South Korea, investigators retrospectively analyzed surgeries performed from December 2013 through December 2024. Preoperative 3.0-T MRI preceded arthroscopic lateral meniscus (LM) stability assessment in 53 HLM knees and 53 propensity-score-matched, arthroscopically assessed non-HLM surgical controls. HLM required probing that subluxated the posterior horn anteriorly beyond the lateral femoral condyle apex. Matching accounted for age, sex, body mass index, discoid LM status, and concurrent surgery type; investigators excluded repairs for ordinary intrameniscal tears and a concomitant tibial plateau fracture. Blinded radiologist and orthopedic-surgeon readers measured sagittal LM–popliteal tendon distance, sagittal and coronal region of interest (ROI) area and normalized T2 signal intensity (SI) ratios, and superior and inferior popliteomeniscal fascicle (PMF) appearance. Each fascicle received a type I grade of 1, type II grade of 0.5, or type III grade of 0; the grades were summed. Investigators used paired comparisons, Firth regression, receiver operating characteristic analysis, a Youden-derived cutoff, and internal bootstrap validation.
Static LM–popliteal tendon distance and sagittal and coronal ROI area did not differ significantly between groups. Normalized sagittal and coronal SI ratios were higher with HLM, while absent superior and inferior PMFs were more frequent. Lower summed PMF scores corresponded to more observed HLM within the matched sample. Sagittal SI ratio was associated with HLM in univariable analysis but not when included with PMF score; the score retained an association in the two-variable Firth model (adjusted odds ratio 0.106; 95% confidence interval 0.040–0.281; p<0.001).
The PMF-only model had an area under the curve (AUC) of 0.794 (95% confidence interval 0.709–0.879). Investigators selected a combined-score cutoff of ≤1.0 using the Youden index. Adding sagittal SI ratio did not significantly improve discrimination. Bootstrap validation assessed performance internally, rather than in an independent population.
At the selected cutoff, sensitivity was 58.5%, specificity was 86.8%, and accuracy was 72.6%. Those performance measures describe the matched surgical cohort, not an outpatient population being evaluated for knee symptoms.
Static MRI cannot reproduce the dynamic displacement used to establish HLM at arthroscopy. The retrospective, single-center surgical cohort included heterogeneous concurrent knee pathology but no healthy controls; historical symptoms, examination, and treatment records were incomplete. Imaging vendors and practices varied, and neither the modified PMF grading nor its cutoff underwent external validation. Propensity matching balanced selected surgical characteristics, not causal risk or prevalence among unselected patients. Limited sensitivity means a higher score cannot exclude HLM; a lower score cannot establish it or determine whether arthroscopy is indicated.
The authors concluded that combined superior and inferior PMF appearance provided adjunctive MRI information associated with arthroscopically confirmed HLM in this selected surgical cohort, rather than a stand-alone diagnostic or rule-out measure.
Clinician Questions
How was the sagittal MRI signal intensity ratio for hypermobile lateral meniscus calculated?
For hypermobile lateral meniscus assessment, investigators divided the signal intensity in the sagittal region between the lateral meniscus posterior horn and popliteal tendon by the mean signal intensity of cancellous bone reference regions in the distal femoral condyle and proximal tibia. This normalized MRI signal measure did not directly quantify meniscal motion.
What MRI appearance distinguishes type II from type III popliteomeniscal fascicles in hypermobile lateral meniscus assessment?
In MRI assessment of the superior and inferior popliteomeniscal fascicles for hypermobile lateral meniscus, type II indicated a band that did not reach the popliteal tendon or was poorly visualized with high signal. Type III indicated no discernible fascicular band.
This content is intended for healthcare professionals for educational purposes. The article and its image were developed with AI assistance and reviewed by members of the ReachMD team prior to publication. Please refer to the original source linked for the complete and most up-to-date information.