
TyG Index Mortality Signal Depends on Diabetes in Stroke ICU
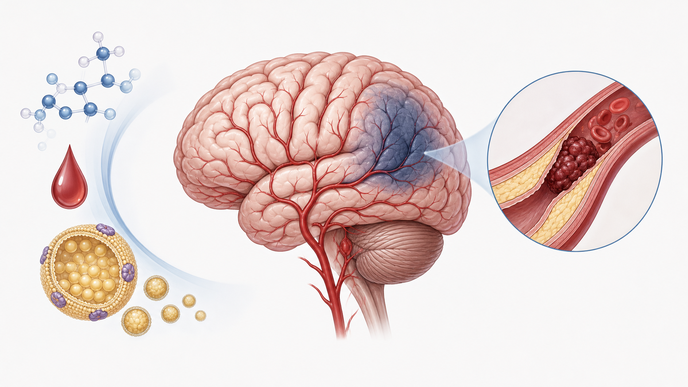
Key Takeaways
- Among 2,584 critically ill adults with cerebrovascular disease, all-cause mortality was 18.7% at 30 days, 23.2% at 90 days, and 28.9% at 365 days.
- After full adjustment, the admission TyG index was not significantly associated with 30-day or 365-day mortality in the overall cohort and showed only a borderline association at 90 days.
- Diabetes status significantly modified the TyG-mortality relationship across all three follow-up windows.
- Higher TyG was associated with higher mortality only in patients without diabetes, not in patients with diabetes.
In Wang and colleagues’ Scientific Reports cohort study, investigators analyzed Medical Information Mart for Intensive Care IV (MIMIC-IV) version 3.1 data from Beth Israel Deaconess Medical Center collected from 2008 to 2019. The cohort included 2,584 adults with a first intensive care unit (ICU) admission for cerebrovascular disease after excluding prior hospitalizations, missing admission glucose or triglyceride values, and discharge or death within 24 hours. The TyG index was defined as ln[TG(mg/dL) × glucose(mg/dL)] / 228 using the first glucose and triglyceride values recorded within 24 hours of ICU admission. Investigators modeled 30-day all-cause mortality as the primary outcome and 90-day and 365-day all-cause mortality as secondary outcomes with sequential Cox models through Model 5, along with diabetes-stratified and sensitivity analyses. The design was built to test whether diabetes status changed the prognostic signal of TyG.
The admission TyG signal weakened as comorbidities, physiologic measures, laboratory values, interventions, and diabetes status were layered into the models. In fully adjusted Model 5, the hazard ratio (HR) per 1-unit TyG increase was 1.15 (95% confidence interval [CI] 1.00-1.32; P = 0.055) for 30-day mortality, 1.14 (95% CI 1.00-1.30; P = 0.043) for 90-day mortality, and 1.11 (95% CI 0.98-1.24; P = 0.095) for 365-day mortality. These estimates left the overall cohort with limited independent prognostic value for admission TyG.
In the diabetes-stratified TyG mortality analysis, diabetes status significantly modified the association between admission TyG and mortality, with interaction P values of 0.033 at 30 days, 0.004 at 90 days, and 0.005 at 365 days. After full adjustment, no independent TyG-mortality association was seen in patients with diabetes. Diabetes status materially changed how the admission TyG signal mapped to mortality.
Among patients without diabetes, each 1-unit TyG increase was associated with higher mortality at 30 days (HR 1.25, 95% CI 1.04-1.50), 90 days (HR 1.26, 95% CI 1.07-1.49), and 365 days (HR 1.21, 95% CI 1.03-1.40). In complete-case analysis of the overall cohort, the borderline 90-day TyG-mortality association attenuated to non-significance; additional adjustment for Acute Physiology Score III (APS III) and Simplified Acute Physiology Score II (SAPS II) did not materially change the primary diabetes-stratified pattern. The positive signal remained concentrated outside diabetes.
The authors noted that the retrospective observational design and reliance on a single-center ICU database leave room for residual confounding, and that TyG was based on a single admission measurement without confirmed fasting status. They also reported that the type 1 diabetes subgroup was too small for reliable adjusted analysis.
Overall, the study suggests that TyG may function mainly as a prognostic biomarker in critically ill cerebrovascular disease patients without diabetes; any management implications are hypothesis-generating and require further validation.
Clinician Questions
Which cerebrovascular ICU patients do TyG mortality findings apply to?
The findings apply to adults with first ICU admissions for ICD-coded cerebrovascular disorders in MIMIC-IV at Beth Israel Deaconess Medical Center, after excluding prior hospitalizations, missing admission glucose or triglyceride measurements, and discharge or death within 24 hours. The cohort reflects a single-center ICU population rather than all patients with stroke or other cerebrovascular disease.
Why were APS III and SAPS II left out of the primary TyG mortality model?
The authors excluded Acute Physiology Score III and Simplified Acute Physiology Score II from the primary adjusted model because those severity scores include glucose and other metabolic variables that overlap with TyG, raising concern for overadjustment. When APS III and SAPS II were added in sensitivity analysis, the main diabetes-stratified pattern was materially unchanged.
What did the study report about prediabetes and diabetes subtype in the TyG analysis?
Among patients without diabetes, a normoglycemic sensitivity subgroup showed adjusted TyG-mortality associations at 30 and 90 days, but not clearly at 365 days; the prediabetic subgroup was too small for reliable modeling, and interaction by prediabetes status was not significant. Among patients with diabetes, no independent association remained after full adjustment, and the type 1 diabetes subgroup was too small for reliable conclusions.
Recommended Reading
- For more on acute ischemic stroke outcomes: IV Thrombolysis Linked to Better Mild Stroke Outcomes