
HIV-Associated Adipose Fibrosis Linked to Insulin Resistance
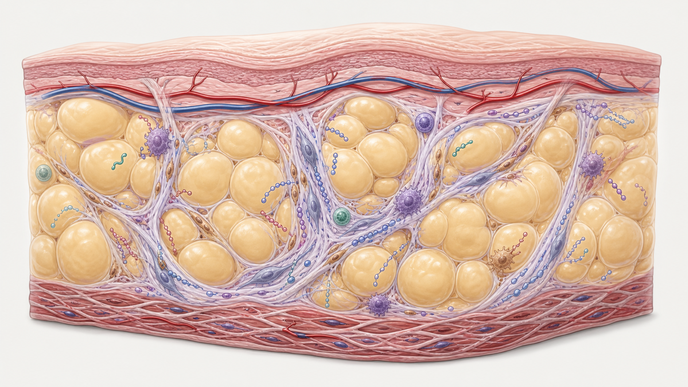
Key Takeaways
- In adults with and without HIV who were compared after exclusion of type 2 diabetes, subcutaneous adipose tissue fibrosis was higher in the HIV group, with the clearest separation among participants with normal body fat.
- Within HIV, subcutaneous adipose tissue fibrosis was associated with Homeostatic Model Assessment for Insulin Resistance even though body mass index and percent body fat were not.
- Legacy d-drug exposure, current integrase strand transfer inhibitor use, CD4 count, and adiposity were not independently associated with subcutaneous adipose tissue fibrosis within the HIV group.
- HIV-associated subcutaneous adipose tissue fibrosis showed a distinct signature with COL14A1 and immune-gene upregulation, downregulation of lipid-metabolic and insulin-signaling pathways, and a parallel endotrophin signal.
In JCI Insight, investigators compared SAT fibrosis and metabolic measures in 46 people with HIV (PWH) and 74 people without HIV (PWoH) after excluding type 2 diabetes. All PWH had undetectable plasma HIV RNA for at least 1 year before enrollment. SAT fibrosis was quantified by hydroxyproline, body composition by dual-energy x-ray absorptiometry (DXA), and insulin resistance by the Homeostatic Model Assessment for Insulin Resistance (HOMA-IR). The group also profiled fibrosis-related SAT transcription with a targeted NanoString panel and measured plasma endotrophin as a circulating extracellular matrix (ECM) remodeling marker, with additional stratification by sex-specific body-fat categories.
SAT hydroxyproline was higher in PWH overall (P = 0.0004) and remained independently associated with HIV status after adjustment for sex, age, race, and percent body fat (P = 0.002). The excess was concentrated in participants with normal body fat (P < 0.0001), whereas the high-body-fat subgroup did not differ significantly. This pattern supports excess SAT fibrosis in HIV that was not explained by greater adiposity alone.
Within-group analyses showed different fibrosis patterning by HIV status. In PWoH, SAT fibrosis tracked with both adiposity and insulin resistance, whereas in PWH it tracked with insulin resistance but not with body mass index or percent body fat. Among PWH with normal body fat, SAT fibrosis correlated with HOMA-IR (ρ = 0.61, P < 0.05). SAT from PWH also showed an HIV-associated transcriptional program marked by ECM-remodeling and immune-related upregulation, including COL14A1, alongside reduced lipid-metabolic and insulin-signaling pathways. Plasma endotrophin was elevated in PWH and independently correlated with SAT fibrosis.
These associations remain descriptive rather than causal, and the cohort excluded adults with established type 2 diabetes, so the findings describe metabolic dysfunction short of diagnosed diabetes. The transcriptional work came from a smaller tissue subset and used a targeted fibrosis panel rather than an unrestricted transcriptome-wide survey. A complementary false discovery rate analysis preserved the overall direction of the molecular pattern. Endotrophin therefore remains a candidate noninvasive correlate of SAT fibrosis rather than a validated clinical test.
The investigators interpreted the findings as evidence that HIV-associated SAT fibrosis may be biologically distinct from obesity-associated fibrosis and linked to insulin resistance independent of adiposity in this cohort. In this study population, the paired tissue and circulating-marker signals supported a distinct fibrosis phenotype within treated HIV.
Clinician Questions
Do these SAT fibrosis findings in HIV apply to people with established diabetes or uncontrolled viremia?
The cohort excluded participants with type 2 diabetes, and the HIV group had sustained virologic suppression before enrollment, so the findings are bounded to virally suppressed adults without established diabetes and do not directly establish the same pattern in uncontrolled HIV or established diabetes.
How was normal versus high body fat defined in this HIV SAT fibrosis analysis?
Body composition was measured by DXA, and sex-specific thresholds were used: men with body fat below 25% and women below 35% were classified as normal body fat, while higher values were classified as high body fat.
What genes and pathways distinguished the HIV-associated SAT fibrosis signature?
Targeted SAT transcriptomic profiling found upregulated transcripts in PWH including COL14A1, ELN, LAMC1, TIMP1, TIMP2, CD14, CD209, and CCL4, while downregulated transcripts included CETP, ELOVL6, FABP5, and PNPLA3. Overall, the pattern combined ECM remodeling and immune activation with reduced lipid-metabolic and insulin-signaling activity.
Why did the authors describe endotrophin as a potential marker of SAT fibrosis in HIV?
Endotrophin was measured as a circulating marker of ECM remodeling and moved in parallel with SAT fibrosis in PWH. The authors framed it as a plausible noninvasive biomarker candidate rather than a validated clinical test.