
BMI and Hematocrit Predict ESRD Risk in Type 2 Diabetes
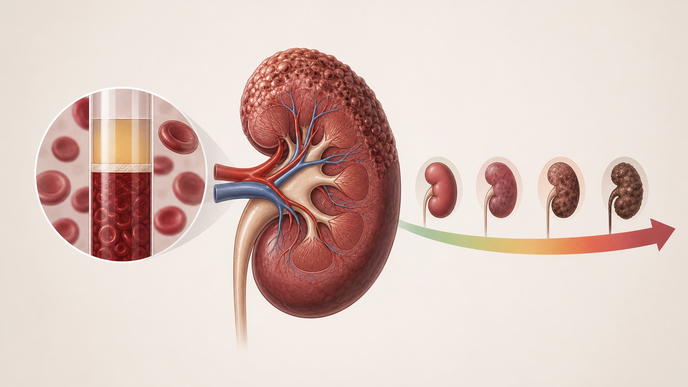
Key Takeaways
- Among adults with T2DM followed for 3 years at a Shanghai center, 16% progressed to ESRD.
- Higher BMI was associated with greater renal failure risk across both the multivariable MR analysis and the retrospective clinical cohort.
- Higher hematocrit was associated with lower renal failure risk across both the genetic and clinical analyses.
- The logistic-regression nomogram showed strong discrimination, good reported calibration, and the highest reported AUC among the compared models.
In the Wang et al study of MR-based and cohort-based risk factors for progression from T2DM to ESRD, investigators paired two-sample Mendelian randomization (MR) using East Asian IEU OpenGWAS data with a retrospective clinical cohort. The genome-wide association study (GWAS) component used the T2DM dataset ebi-a-GCST010118 with 433,540 participants and the chronic renal failure (CRF) dataset ebi-a-GCST90018602 with 176,462 participants, with CRF serving as the renal outcome proxy for the MR analysis. The cohort included 875 adults with T2DM at Qingpu Branch of Zhongshan Hospital, Fudan University, enrolled from 2016 to 2023 and followed for 3 years for progression to end-stage renal disease (ESRD), with genome-wide significant single-nucleotide polymorphism selection, linkage disequilibrium clumping, inverse variance weighted (IVW) estimation, and logistic-regression model development followed by internal validation and comparison with XGBoost, random forest, and support vector machine models.
In univariable MR, genetically predicted glucose, body mass index (BMI), hematocrit, and T2DM were each associated with chronic renal failure risk. After adjustment for genetic liability to T2DM, higher BMI remained associated with greater risk, with an odds ratio (OR) of 1.592 (95% confidence interval [CI] 1.143–2.218; p=5.95 × 10⁻³), while higher hematocrit remained protective, with an OR of 0.492 (95% CI 0.320–0.756; p=1.20 × 10⁻³). Serum glucose was excluded from the multivariable model because its instrument was weak, and the remaining sensitivity checks supported the direction of effect without evidence of material pleiotropy.
In the retrospective cohort, patients who progressed generally entered follow-up with a more adverse renal and metabolic profile. The logistic-regression nomogram for progression from T2DM to ESRD achieved an area under the curve (AUC) of 0.880 (95% CI 0.850–0.910) and a bootstrap-corrected AUC of 0.878 (95% CI 0.850–0.908) after 500 resamples, with good reported calibration and the highest reported AUC among the compared models in this dataset.
The 2 study components did not use identical renal endpoints, because the MR analysis used CRF as a proxy outcome whereas the clinical cohort tracked ESRD. The authors also noted that the genetic data were East Asian, the clinical data came from a single retrospective Shanghai center, some missing values were imputed, time-dependent modeling was not used, and validation remained internal. Those constraints make the findings explicitly non-U.S. in setting and support cautious interpretation until multicenter and multiethnic validation is available.
Across the MR analysis—which was not restricted to patients with T2DM and used chronic renal failure as a proxy outcome—and the retrospective T2DM cohort, BMI and hematocrit were the most consistent factors associated with kidney-failure risk. Creatinine, SBP, and albumin added cohort-specific predictive information to the clinical model. According to the authors, the nomogram performed well internally and still requires external validation.
Clinician Questions
How did the renal endpoint differ between the MR and cohort parts of this T2DM progression analysis?
The Mendelian randomization analysis used chronic renal failure as a proxy renal outcome from GWAS data, whereas the retrospective clinical cohort used progression to ESRD as its endpoint. The cohort directly tracked ESRD progression in adults with T2DM, whereas the MR component used chronic renal failure GWAS data as a proxy outcome and was not restricted to a T2DM-only population.
Which adults with T2DM were included in the cohort used to build the ESRD nomogram?
The cohort included 875 adults aged 18 years or older with T2DM treated at Qingpu Branch of Zhongshan Hospital, Fudan University, between 2016 and 2023 and followed for 3 years. The authors excluded patients with type 1 or secondary diabetes, acute diabetic crises, primary glomerular disease or systemic causes of secondary renal injury, prior dialysis or kidney transplant, major infection or organ failure, malignancy or pregnancy, solitary kidney or nephrotoxic injury, and incomplete data or loss to follow-up.
Why was serum glucose excluded from the multivariable MR model for diabetic kidney progression?
The investigators excluded serum glucose because its genetic instrument had an F-statistic of 5.65, below the conventional threshold used to guard against weak-instrument bias. They also reported that serum glucose was not significant in that multivariable setting, so the exclusion reflected model robustness rather than a broader claim about glycemia.
Recommended Reading
- For more on early diabetic nephropathy markers: Urinary Podocalyxin May Flag Early Diabetic Nephropathy
- For more on T2D and diabetic kidney disease: Finerenone Associated with Lowered BP in T2D and DKD